疲劳
疲劳是指材料(或结构)由于反复循环应力导致裂纹逐渐扩展而失效的过程。循环应力通常远低于材料的屈服强度。疲劳是超声谐振器的主要失效模式。
疲劳是一个非常复杂的课题;文献中确实有数以千计的论文。本节仅对与超声谐振器设计相关的主题作有限的概述。
疲劳试验
疲劳试验对试样施加循环应力。此外,还可能同时施加静载荷。当试样发生疲劳失效或达到规定的循环次数时,试验即停止。
疲劳试验可大致按试验目的、试验频率和载荷类型分类。
试验目的
- 材料评估。这类试验用于确定受试材料的疲劳特性。可以在不同应力下测试不同试样,从而绘制 S‑N 曲线(见下文)。或者,也可以在单一应力下测试所有试样,以便比较不同材料(尽管这可能产生反常结果)。这类疲劳试验使用专门设计的试样。
- 设计评估。这类试验用于比较不同谐振器设计的寿命。由于试样成本的原因,这类疲劳试验通常只在单一应力水平下进行。
试验频率
"常规"疲劳试验在相对较低的频率下进行,通常约为 30 Hz。这类试验有时以早期德国研究者的名字称为 Wöhler 试验。(见 Juvinall[1],第 205 - 206 页。)除非另有说明,文献中的疲劳数据均由这类试验测得。
加速疲劳试验在超声频率下进行。其与常规试验结果的对应关系尚不完全明确。
载荷类型
常规试验可以对试样施加轴向载荷、弯曲载荷、旋转弯曲载荷或扭转载荷。超声试验几乎完全采用轴向载荷。
疲劳 S‑N 曲线图
以下讨论主要适用于材料疲劳试验,而非设计疲劳试验。
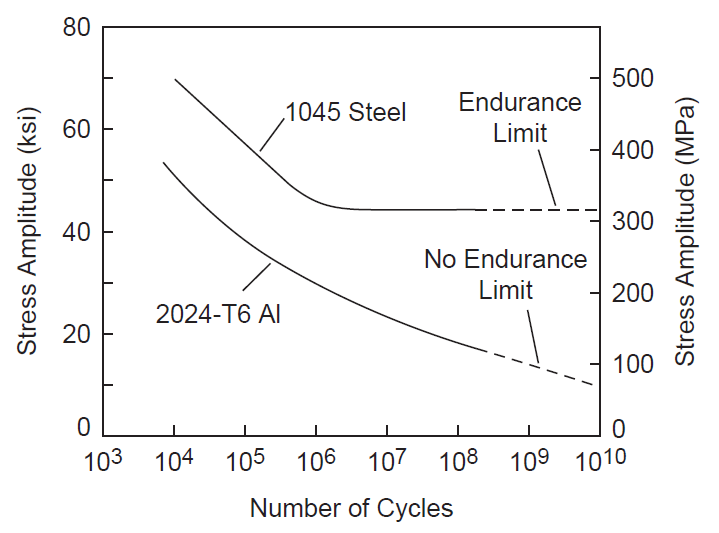
当试样在多个应力水平下测试时,所得的失效数据绘制在 S‑N 曲线图上,其中 S(应力)绘于纵轴,N(失效循环次数)绘于横轴。横轴通常为对数标尺,纵轴可以是线性或对数标尺。图 1 展示了一幅典型的 S‑N 曲线图。
疲劳 S‑N 曲线是对原始失效数据拟合得到的。该疲劳曲线代表平均失效水平(即对于给定应力,50% 的试样将存活、反之 50% 将失效的寿命)。
文献中经常报告的一个参数是应力比 \( R \)。应力比可以计入静应力的影响。然而,对于大多数超声谐振器,静应力与动态应力相比可以忽略不计。在这种情况下,应力是"完全交变"的——即 \( R = -1 \)(见此处)。
文献中经常报告 \( R ≠ -1 \) 的疲劳试验(即叠加了静应力的试验)。一般而言,这类试验结果不应应用于超声谐振器(见此处)。
按寿命对材料分类
疲劳的一个普遍特征是:试样寿命随循环应力的降低而增加。
持久极限
材料可按是否具有持久极限分类——即存在一个循环应力阈值,低于该阈值时,即使经过非常多的循环次数材料也不会失效(本质上是无限寿命)。材料必须经受的"非常多的循环次数"通常至少为 107(Campbell[1],第 244 页),但也可能高达 1010 甚至更高(Marines-Garcia[1])。(注意,超声循环累积得非常快。例如,一个 20 kHz 的铝变幅杆若每天运行 24 小时、占空比 50%,则需要一个生产年内承受 1600 万秒的运行时间(即 3x10¹¹ 次超声循环)才能存活。)
持久极限的特征是 S‑N 曲线上存在一个"拐点",曲线在该处变平并与 X 轴(循环次数)平行。钛和铁基材料被认为具有持久极限(见图 1,引自 Campbell[1],第 246 页)。持久极限的数值取决于许多因素(见下文)。如果谐振器由具有持久极限的材料制成,则一般应在施加适当安全系数后,将其峰值应力设计在持久极限以下。(如果谐振器预期寿命有限(例如一次性医用谐振器),则可以容忍更高的应力。)
疲劳强度
许多材料(如铝)没有持久极限——即即使在很低的应力下,它们最终也会失效。因此,由这些材料制成的谐振器必须按可接受的有限寿命来设计。虽然铝没有持久极限,但 S‑N 曲线的斜率随应力降低而趋于平缓(参考文献待补),因此准无限寿命是可能的。没有持久极限的材料被赋予一个疲劳强度值——即在规定的循环次数下 50% 受试试样发生失效的应力。例如,matweb.com 给出的 Al 7075-T6 疲劳强度为 5x10⁸ 次循环下 159 MPa(完全交变应力)。然而,这个疲劳强度值的用途有限,因为它只是一条未完整给出的 S‑N 曲线上的单一点,因此无法用来估计任何其他应力下的寿命。
(Maennig[1] 给出了一种统计实验方法,用于确定与疲劳极限对应的疲劳循环次数——如果特定材料确实存在疲劳极限的话。)
|
|
|
确定可接受的工作应力
在谐振器设计过程中,应确定谐振器的应力(例如通过有限元分析)。该应力在参考振幅下确定,通常为 1 微米峰值。例如,应力可能被确定为 1 微米峰值下 1.2 MPa。然后可将该应力线性缩放到任何其他振幅。
根据所指定的参数,谐振器应力可以有两种用法 —
- 已指定谐振器的振幅。如果谐振器的振幅已经确定(例如为了执行特定应用),则可将由此产生的谐振器应力与材料的 S‑N 曲线进行比较,以估计谐振器的寿命。
- 已指定谐振器的寿命。如果要求一定的谐振器寿命,则可用 S‑N 曲线估计最大谐振器应力。然后确定该应力下的最大振幅。该数值常被刻印在谐振器的侧面。
疲劳裂纹起始于材料中随机分布的微观缺陷。因此,与数据离散度较小的静态试验(如拉伸试验)不同,疲劳试验的数据离散度往往很大,即使对于精心制备的试样也是如此。对于"生产态"试样(如实际工作的变幅杆),离散度更大。因此,平均 S‑N 曲线(即 50% 失效)并不真正适合设计用途。
因此,为了以合理的失效率获得可接受的寿命,工作应力必须降低到平均 S‑N 曲线所示值以下。例如,如果可接受 5% 的失效率,则必须建立 5% 失效曲线。而只有在多个应力水平下进行了足够数量的试验,才能建立这条 5% 失效曲线。因此,尽管理论上需要大量试验,但由于时间、预算或其他限制,这可能无法实现。即使进行了这类试验,已发表的文献也往往只给出 S‑N 曲线而不提供原始数据,因而无法确定数据的离散程度。更糟的是,许多参考文献只引用单一的疲劳强度值(见上文)。
因此,确定许用应力的可接受值相当困难。
影响疲劳的因素
实验室疲劳试验(S‑NL)是在高度受控("理想")条件下进行的。(此处将实验室疲劳试验记为 S‑NL,以区别于真实工况下的疲劳结果。)S‑NL 试验使用精心制备的试样。当使用 S‑NL 数据估计工作谐振器的疲劳时,必须注意计入真实工况条件。否则,对工作谐振器的疲劳估计将不正确。这就要求与 S‑NL 试验相比降低谐振器的许用应力。遗憾的是,估计这些复合因素的影响是困难的。
在使用 S‑NL 数据试图确定真实工况下的疲劳时,应考虑以下因素。
显微组织
仅仅说明化学成分(Ti-6Al-4V)并不能描述材料的显微组织,后者受加工方法(锻态、轧制、挤压)、热处理、精整方法等影响。所有这些都会影响疲劳性能。
加工方法
材料可以经锻造、挤压、轧制、铸造等工艺制成。
热处理
热处理取决于气氛(空气、氩气、氮气等)、温度、加热和冷却过程中各温度下的保温时间、淬火介质(空气、水、油等)、后处理等。这些参数部分取决于零件的尺寸。
例如,考虑 107 次循环下无缺口 Ti–6Al–4V。退火态的持久极限为 510 MPa,而固溶处理并时效(STA)态为 700 MPa。(重要 — 试验条件未予说明。因此,这些持久极限只能用于比较。)
钛的热处理会影响持久极限。例如,matweb.com 给出的 107 次循环下普通退火态无缺口 Ti–6Al–4V 的持久极限为 510 MPa,而 STA(固溶处理并时效)态为 700 MPa。不过,重要的带缺口结果见附录 E。(重要:试验条件未予说明。因此,这些持久极限只能用于比较。)
表面状态
表面状态至关重要,因为大多数疲劳裂纹都起始于表面。
表面质量
S‑NL 试验试样通常具有精细抛光的表面,抛光方向往往平行于试样轴线。真实谐振器通常不会得到这样的处理,因此在相同应力水平下,其寿命很可能短于 S‑NL 试验试样。
残余应力
残余拉应力可能降低疲劳寿命。它们可能由某些机加工操作造成(例如苛刻的电火花加工(EDM)、苛刻的磨削等)。
另一方面,Donachie[1](第 177 页)指出:"关于钛合金还有一点值得注意:文献中报告的疲劳数据往往来自经车削、铣削等引入了有利表面残余应力的材料。完全消除应力的表面或化学铣切的表面,其疲劳强度可能低于所报告的合金性能水平,因为后者已被有利的——即压缩的——应力向上拔高。"
表面处理
表面处理包括镀层(可能有益也可能有害)和喷丸(在某些情况下可能有益)。
应力集中
S‑NL 试验试样常加工出缺口以产生特定的应力集中。如果应力集中系数 Kt 大于 1.0,则会予以注明。除非两者的 Kt 相同,否则谐振器的真实疲劳将与 S‑NL 试验数据显著不同。理想情况是 S‑NL 试验试样的 Kt 为 1.0(即无应力集中)。
机加工缺陷
真实谐振器可能存在 S‑NL 试样所没有的机加工缺陷(例如未圆滑过渡的圆角)。如果这些缺陷位于高应力区域,则必须降低许用应力。
试验方向
如果材料不是各向同性的,则疲劳可能受晶粒方向相对于外加应力方向的影响。例如,见下文 Boyer[1](第 431 页)的图。(原始来源:Polmear, I. J., Light Alloys, American Society for Metals, Metals Park, OH, 1981, p. 193)
|
|
|

频率
超声疲劳试验通常在 20 kHz 或更高频率下进行。这些频率是常规疲劳试验的 100—1000 倍。这就带来一种可能性:常规疲劳试验(最常见可得)的数据可能无法准确预测超声疲劳。例如,在腐蚀性气氛中进行常规疲劳试验时,循环之间可能有足够的时间让腐蚀介质迁移到疲劳裂纹中,而在超声频率下循环间隔很短,这种迁移可能受阻。(参考文献待补)
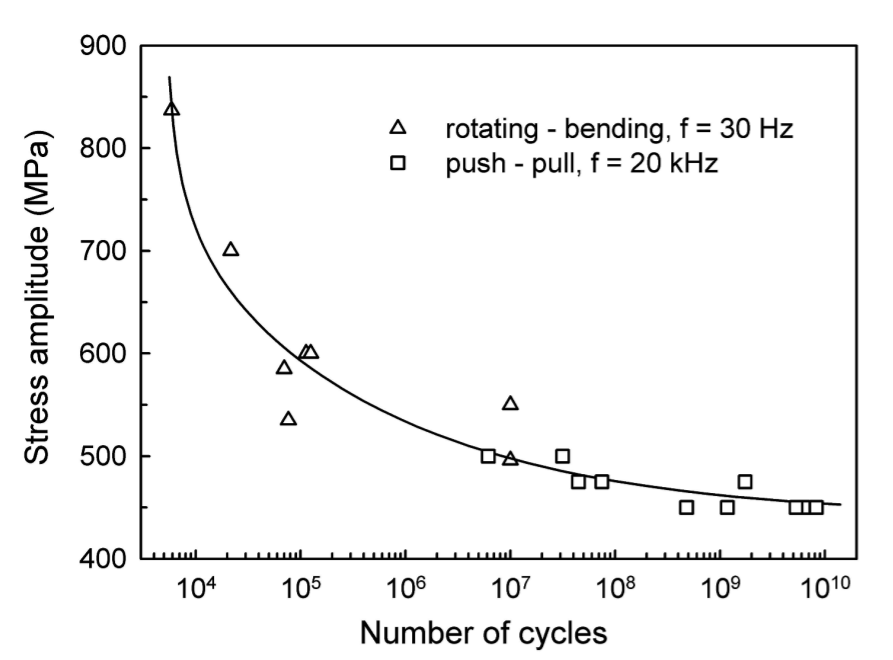
超声疲劳试验往往与常规低频 S‑NL 疲劳试验表现出合理的一致性(示例见下文),但这一问题尚未完全解决。见 Wells[1]。另见 Neppiras[1B](第 707 页),他指出:"测量已经证实,疲劳极限是工作频率的函数[比较超声结果与低频试验]。"
Janeĉek[1] 对 Ti-6Al-4V(双态显微组织)进行了试验:30 Hz 旋转弯曲至 107 次循环,以及 20 kHz 拉-压在 107 至 1010 次循环之间。所得 SN 曲线(图 2)无论频率或试验方式如何都是平滑的。
|
|
|
试验方式
在轴向疲劳试样中,应力在整个横截面上是均匀的。然而,在旋转梁和弯曲试样中,应力在表面最高、在内部降低。因此,与应力在整个横截面上均匀分布的轴向受载试样相比,这类试样可能允许更高的应力。因此,为计入轴向加载的影响,Juvinall[1](第 231 页)建议将旋转梁和交变弯曲试验的持久极限 S'n 降低约 10%。
尺寸
较大的零件通常允许较低的应力,因为有更多的材料(和潜在缺陷)可能成为疲劳裂纹的起源。见 Juvinall[1](第 231 页)。
材料的形状
(棒材、条材、板材、薄板)
静应力
当存在拉伸静应力时,许用超声应力将降低。这类应力在自由端承受横向载荷的长医用探头中可能很显著。此外,当螺柱拧到底时,螺柱孔底部会产生显著的拉伸静应力。
环境
不利的环境因素(温度、腐蚀介质、空化)可能降低许用应力。注意,温度升高可能来自谐振器材料内部因超声振动产生的热量(即磁滞型发热),也可能来自超声工艺产生的热量(例如从熔融塑料传递到变幅杆端面的热量)。
缺口敏感性
缺口通常会降低零件的持久极限。对于给定的缺口,材料的状态可能影响其对缺口的敏感性。如果材料对缺口非常敏感,则与无缺口状态相比,其持久极限会大幅下降。反之,如果材料对缺口完全不敏感,则其持久极限将与缺口不存在时相同。
例如,淬硬钢通常比同一种钢的较软状态更敏感。因此,虽然较硬的钢在无缺口时可能具有更高的持久极限,但在有缺口时较软的钢可能反而占优。钛也是如此吗?STA 与退火态相比?Ti-6Al-4V 与 Ti-7Al-4Mo 相比(基于 UTS)?
Ti–6Al–4V STA 的缺口敏感性见附录 E。
改善疲劳性能
残余压应力
喷丸
"应当注意,拉伸弹簧通常不适合进行喷丸处理。"(http://www.centuryspring.com/pdfs/377-381APPENDIX-A.pdf)
涂层
渗氮、渗碳、其他
螺纹
可以通过增大螺纹牙底圆角半径以及调整制造方法(螺柱在热处理后再滚压螺纹,或使用挤压丝锥)来改善螺纹疲劳。详见详细说明。
材料
更多信息见以下内容。
Fatigue
Contents
- Fatigue tests
- Fatigue S‑N graphs
- Determining acceptable working stress
- Factors that affect fatigue
- Improving fatigue
- Materials
- Figures
- Figure 1. Comparison of steel and aluminum fatigue behavior
Fatigue is a process where a material (or structure) fails because of progressive crack growth due to repeated cyclic stress. The cyclic stress is usually considerably below the material's yield strength. Fatigue is the predominate failure mode for ultrasonic resonators.
Fatigue is a very complex topic; the literature contains literally thousands of papers. This section will present a limited overview of topics that are relevant to ultrasonic resonator design.
Fatigue tests
Fatigue tests apply cyclic stresses to specimens. In addition, static loads may be simultaneously applied. Each test is stopped when the specimen fails by fatigue or when a specified number of cycles has occurred.
Fatigue tests can be broadly categorized according to the test purpose, test frequency, and load type.
Test purpose
- Material evaluation. These tests determine the fatigue characteristics of a test material. Different specimens may be tested at different stresses so that an S‑N curve can be developed (see below). Alternately, all specimens may be tested at a single stress so that different materials can be compared (although this may produce anomalous results). Fatigue tests of this type use specially designed test specimens.
- Design evaluation. These tests are used to compare the lives of different resonator designs. Because of the cost of the specimens, these fatigue tests are often conducted at only a single stress level.
Test frequency
"Conventional" fatigue tests are conducted at relatively low frequencies, typically around 30 Hz. Such tests are sometimes referred to as Wöhler tests after the early German investigator. (See Juvinall[1], pp. 205 - 206.) Unless otherwise specified, fatigue data from the literature will have been determined from this type of test.
Accelerated fatigue tests are conducted at ultrasonic frequencies. The correspondence to conventional test results is not entirely clear.
Load type
Conventional tests can load the specimen axially, by bending, by rotating-bending, or by torsion. Ultrasonic tests use axial loading almost exclusively.
Fatigue S‑N graphs
The following discussion applies primarily to material fatigue tests rather than design fatigue tests.
When specimens are tested at multiple stress levels, the resulting failure data are plotted on S‑N graphs where S (stress) is plotted on the vertical axis and N (number of cycles to failure) is plotted on the horizontal axis. The horizontal axis is typically a log scale and the vertical axis may be either a linear or log scale. Figure 1 shows a typical S‑N graph.
A fatigue S‑N curve is fitted to the raw failure data. This fatigue curve represents the mean failures (i.e., for a given stress, the life at which 50% of specimens would have survived and, conversely, 50% would have failed).
One parameter that is frequently reported in the literature is the stress ratio \( R \). The stress ratio can account for the effect of static stress. However, for most ultrasonic resonators the static stress will be negligible in comparison to the dynamic stresses. In this case, the stress will be "fully reversed" — i.e., \( R = -1 \) (see here).
The literature will often report fatigue tests where \( R ≠ -1 \) (i.e., tests with a superimposed static stress). Generally, such test results should not be applied to ultrasonic resonators (see here).
Material classification by life
A general characteristic of fatigue is that a specimen's life increases as the cyclic stress is reduced.
Endurance limit
Materials can be classified according to whether they have an endurance limit — i.e., a cyclic stress below which they will not fail even after a very large number of cycles (essentially infinite life). The "very large number of cycles" to which the material must be tested is typically at least 107 (Campbell[1], p. 244) but may be up to 1010 or even higher (Marines-Garcia[1]). (Note that ultrasonic cycles accummulate very rapidly. For example, a 20 kHz aluminum horn that operates 24 hours per day at a 50% duty cycle would need to endure 16 million operational seconds (i.e., 3x10¹¹ ultrasonic cycles) in order to survive for one production year. )
An endurance limit is characterized by a "knee" in the S‑N curve where the curve flattens and becomes parallel to the X axis (number of cycles). Titanium and ferrous materials are presumed to have endurance limits (see figure 1 from Campbell[1], p. 246). The value of the endurance limit depends on many factors (below). If a resonator is made from a material that has an endurance limit then the resonator should generally be designed so that its peak stress is below the endurance limit, after applying an appropriate factor of safety. (If a resonator is expected to have a limited life (e.g., disposable medical resonators) then a higher stress might be tolerated.)
Fatigue strength
Many materials (e.g., aluminum) do not have an endurance limit — i.e., they will eventually fail even at very low stresses. Therefore, resonators made of these materials must be designed for acceptable finite life. Although aluminum does not have an endurance limit, the slope of the S‑N curve becomes more gradual as the stress is reduced (zzz reference) so quasi-infinite life is possible. Materials that do not have an endurance limit are assigned a fatigue strength value — i.e., a stress at which 50% of tested specimens will have failed at a specified number of cycles. For example, matweb.com says that Al 7075-T6 has a fatigue strength of 159 MPa at 5x10⁸ cycles (completely reversed stress). However, this fatigue strength value has limited utility since it is a single point on an otherwise unspecified S‑N curve and, therefore, cannot be used to estimate the life at any other stress.
(Maennig[1] gives a statistical experimental method for determining the number of fatigue cycles corresponding to the fatigue limit, if a fatigue limit actually exists for the particular material.)
|
|
|
Determining acceptable working stress
During the resonator design process the resonator stress should be established (e.g., from FEA). This stress is determined at a reference amplitude, typically one micron peak. For example, the stress might be established as 1.2 MPa at one micron peak. This stress can then be scaled linearly to any other amplitude.
The resonator stress can be used in two manners depending on what parameter has been specified —
- The resonator's amplitude has been specified. If the resonator's amplitude has been determined (e.g., in order to perform a particular application) then the resulting resonator stress can be compared to the material's S‑N curve in order to estimate the resonator's life.
- The resonator's life has been specified. If a certain resonator life is required then the S‑N curve can be used to estimate the maximum resonator stress. Then the maximum amplitude at this stress can be determned. This value is often etched into the side of the resonator.
Fatigue cracks start at microscopic imperfections which are randomly distributed throughout the material. Thus, unlike static tests (such as tensile tests) which have narrow data scatter, fatigue tests often have wide data scatter, even for carefully prepared specimens. The scatter is even worse for "as produced" specimens such as working horns. Thus, the mean S‑N curve (i.e., 50% failure) is not really suitable for design purposes.
Therefore, in order to obtain acceptable life with a reasonable failure rate, the working stress must be reduced below that indicated by the mean S‑N curve. For example, if a 5% failure rate is acceptable then a 5% failure curve must be established. This 5% failure curve can only be established if a sufficient number of tests have been conducted at a number of stress levels. Thus, although a large number of tests would theoretically be needed, this might not be possible because of time, budget, or other constraints. Even where such tests have been conducted, the posted literature often just presents the S‑N curve without the underlying raw data so that the data spread can not be determined. Even worse, much reference literature cites a single fatigue strength value (see above).
Thus, determining an acceptable value for the allowed stress is quite difficult.
Factors that affect fatigue
Laboratory fatigue tests (S‑NL) are conducted under highly controlled ("ideal") conditions. (Here, laboratory fatigue tests are designated as S‑NL to distinguish them from fatigue results that occur under real-world conditions.) The S‑NL tests use carefully prepared specimens. When using S‑NL data to estimate the fatigue of an working resonator, care must be taken to factor in the real-world conditions. Otherwise, the fatigue estimate for the working resonator will be incorrect. This requires that the allowable resonator stress should be reduced compared to S‑NL tests. Unfortunately, estimating the effect of these compounding factors is difficult.
The following factors should be considered when attempting to determine real-world fatigue when using to S‑NL data.
Microstructure
Simply stating the chemical composition (Ti-6Al-4V) doesn't describe the material's microstructure which is affected by method of processing (wrought, rolled, extruded), heat treatment, finishing method, etc. All of these affect fatigue performance.
Processing method
A material may be forged, extruded, rolled, cast, etc.
Heat treatment
Heat treatment depends on atmosphere (air, argon, nitrogen, etc.), temperatures, duration at each temperature during heating and cooling, quenching media (air, water, oil, etc), post processing, etc. These parameters depend, in part, on the size of the part.
For example, consider unnotched Ti–6Al–4V at 107 cycles. In the annealed condition the endurance limit is 510 MPa compared to 700 MPa when solution treated and aged (STA). (Important — the test conditions were not specified. Therefore, these endurance limits should only be used for comparison.)
Titanium's heat treatment will affect the endurance limit. For example, matweb.com gives 510 MPa for generic annealed unnotched Ti–6Al–4V at 107 cycles versus 700 MPa for STA (solution treated and aged). However, see Appendix E for important notched results. (Important: the test conditions were not specified. Therefore, these endurance limits should only be used for comparison.)
Surface conditions
Surface conditions are critical since most fatigue cracks start there.
Surface finish
S‑NL test specimens typically have a finely polished surface finish, often parallel to the specimen's axis. Real-world resonators would not normally receive such care so their lives would likely be shorter than the S‑NL test specimens at the same stress level.
Residual stresses
Residual tensile stresses may reduce the fatigue life. These may result from some machining operations (e.g., harsh electro-discharge machining (EDM), harsh grinding, etc.).
On the other hand Donachie[1] (p. 177) notes, "One further observation about titanium alloys is that fatigue data reported in the literature often may be on material with favorable surface residual stress induced by turning, milling, etc. Fully stress-relieved or chem-milled surfaces probably have fatigue strengths below the reported alloy capabilities, because the latter have been biased upward by the favorable - that is compressive - stresses."
Surface treatments
Surface treatments include platings (which can either be beneficial or harmful) and shot peening (which may be beneficial under certain circumstances).
Stress concentration
S‑NL test specimens are often machined with notch to give a specific stress concentration. This will be indicated if the stress concentration factor Kt is greater than 1.0. The resonator's real-world fatigue would be significantly different than the S‑NL test data unless the two had the same Kt. The ideal situation is where the Kt for the S‑NL test specimens is 1.0 (i.e., no stress concentration).
Machining defects
The real-world resonator may have machining defects (e.g., unblended radii) that are not present in the S‑NL specimen. If these defects are present in a highly stressed region then the allowable stress would have to be reduced.
Test direction
If a material is not isotropic then fatigue may be affected by the direction of the grain relative to the applied stress. For example, see the graph of Boyer[1] (p. 431) below. (Original source: Polmear, I. J., Light Alloys, American Society for Metals, Metals Park, OH, 1981, p. 193)
|
|
|
Frequency
Ultrasonic fatigue tests are typically conducted at 20 kHz or higher. These frequencies are 100—1000 times greater than conventional fatigue tests. This introduces the possibility that the data from conventional fatigue tests (which is most widely available) may not accurately predict ultrasonic fatigue. For example, conventional fatigue tests in corrosive atmospheres may allow sufficient time between cycles for the corrosion to migrate into the fatigue crack whereas such migration may be impeded at ultrasonic frequencies where the time between cycles is short. zzz - reference.
Ultrasonic fatigue tests often show reasonable agreement with conventional low-frequency S‑NL fatigue tests (see below for an example) but this issue is not completely resolved. See Wells[1]. Also see Neppiras[1B] (p. 707) who states, "Measurements have confirmed that the fatigue limit is a function of the operating frequency [comparing ultrasonic results to low-frequency tests]."
Janeĉek[1] tested Ti-6Al-4V (duplex microstructure) at 30 Hz in rotating bending up to 107 cycles and at 20 kHz in tension-compression between 107 and 1010 cycles. The resulting SN curve (figure 2) was smooth regardless of the frequency or testing mode.
|
|
|
Test mode
In axial fatigue specimens the stresses are uniform across the entire cross-section. In rotating beam and bending specimens, however, the stresses are highest on the surface and reduced in the interior. Therefore, these specimens may allow higher stresses than axially stressed specimens where the stresses are uniform across the cross-section. Therefore, to account for axial loading Juvinall[1] (p. 231) suggests reducing the endurance limits S'n of rotating beam and reversed bending tests by about 10%.
Size
Larger parts generally allow lower stresses because there is more material (and potential defects) from which fatigue cracks may start. See Juvinall[1] (p. 231).
Material’s shape
(rod, bar, plate, sheet)
Static stresses
The allowable ultrasonic stress will be reduced when tensile static stresses are present. Such stresses can be significant in long medical probes that are loaded transversely at the free end. Also, significant tensile static stresses are induced at the bottom of a stud hole when a stud is bottomed.
Environment
Adverse environmental factors (temperature, corrosives, cavitation) may reduce the allowed stress. Note that elevated temperatures may arise from heat that is generated within the resonator material due to the ultrasonic vibration (i.e., hysteresis type heating) and from heat that is generated by the ultrasonic process (e.g., heat that is transferred from the melted plastic to the horn's face).
Notch sensitivity
A notch usually reduces a part's endurance limit. For a given notch, a material's conditions may affect its sensitivity to notches. If a material is very sensitive to notches then it will have a large drop in endurance limit compared to the unnotched state. Conversely, if a material is completely insensitive to notches then it's endurance limit will be the same as if the notch weren't present.
For example, a hardened steel is typically more sensitive than than the same steel in a softer condition. Thus, although the harder steel may have a higher endurance limit when no notch is present, the softer steel may prevail when a notch is present. Same true for Ti? STA vs annealed? Ti-6Al-4V vs Ti-7Al-4Mo (based on UTS)?
See Appendix E for the notch sensitivity of Ti–6Al–4V STA.
Improving fatigue
Residual compressive stress
Shot peening
"It should be noted that extension springs are normally not candidates for shot peening." (http://www.centuryspring.com/pdfs/377-381APPENDIX-A.pdf)
Coatings
Nitriding, carburizing, other
Threads
Thread fatigue can be improved by increasing the thread root radius and by adjusting the fabrication method (rolling after heat treating for studs or with thread-forming taps). See details.
Materials
See the following for additional information.