铝的性能
用途
由于成本相对较低且易于加工,在应力较低且冲击/磨损/冲蚀不重要的场合,铝往往是超声谐振器的首选材料。用途包括 ——
- 大型圆柱形变幅杆
- 大型块形变幅杆
- 母变幅杆
- 低增益增幅杆
- 换能器前驱动块
牌号对照
各种牌号铝的规格对照表可在此处找到。该对照表包含美国、加拿大、英国、法国、德国、意大利和日本的牌号命名。
常用合金
铝有大量合金可供选择。两种常用的合金是 Al 2024‑T4 和 Al 7075‑T6。("T"表示热处理状态。有多种热处理状态可供选择,可能会影响性能。)
疲劳
参见关于疲劳的一般讨论。
大多数铝没有真正的耐久极限。相反,随着循环次数增大,S‑N 曲线的负斜率会变得更加平缓。(不过,请参阅下文的 Varley。)
以下来自 Boyer(第 335 页)的图表展示了 Al 2024‑T4 和 Al 7075‑T6 在低频旋转弯曲试验中的疲劳性能。(原始来源:Sanders[1],第 470 页)上方的实心圆点数据带对应无缺口试样,下方的空心圆点数据带对应严重缺口试样(Kt > 17)。数据带右端的彩色矩形对应未失效的试样(越出试样)。
|
|
|
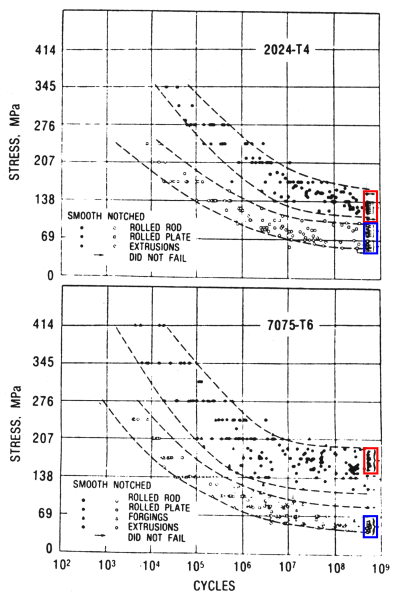
请注意,两种合金的疲劳性能非常相似。在无缺口状态下,两者在约 109 次循环时的疲劳强度都在 140 MPa [20 kpsi] 附近,不过 Al 7075‑T6 的表现略好。在有缺口状态下,Al 7075‑T6 的表现略差。
Boyer[1](第 335 页)指出:"尽管有这些实验室数据,用户发现在实际使用中遇到波动载荷时,某些铝合金的表现明显优于其他合金。例如,机身制造商确定,合金 7075‑T6 的疲劳性能无疑逊于合金 2024‑T3。"Boyer 没有说明这是针对无缺口状态、有缺口状态还是两者。
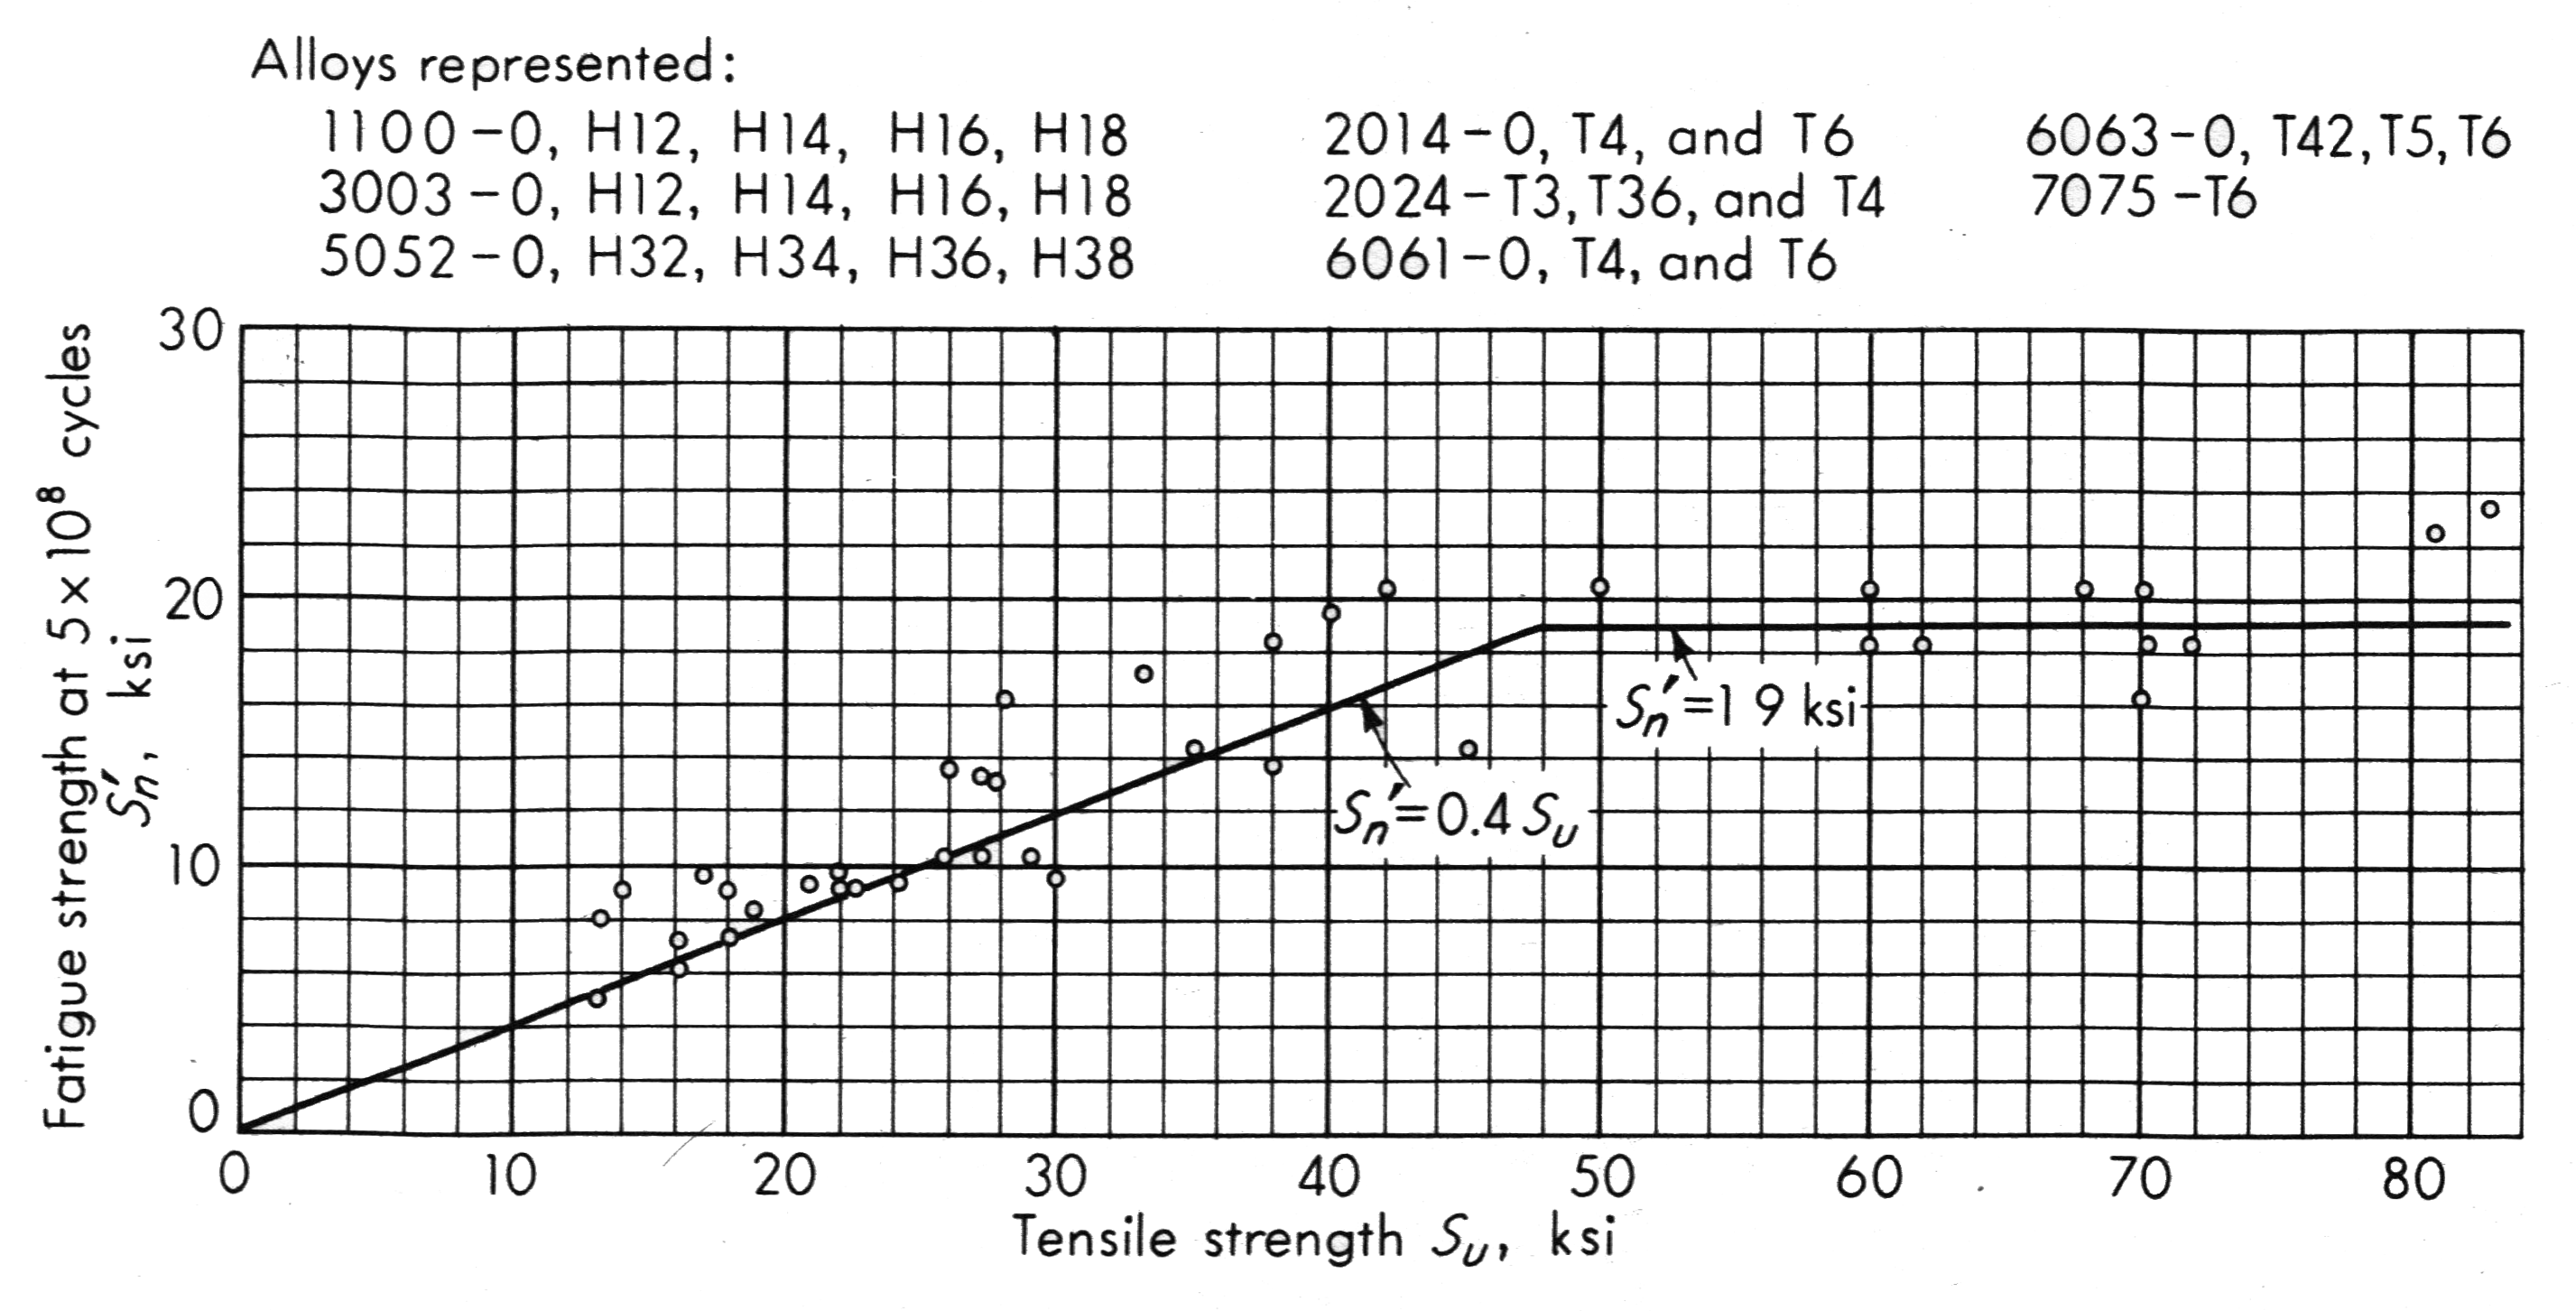
来自 Juvinall[1](第 215 页)的图 2 展示了各种铝合金的疲劳强度与极限抗拉强度之间的关系。在极限抗拉强度不超过约 340 MPa [50 kpsi] 时,疲劳强度约为极限抗拉强度的 40%。但是,如果极限抗拉强度超过 340 MPa,疲劳强度就不再增加,而是稳定在约 138 MPa [20 kpsi]。(注意,最右侧两个数据点的疲劳强度约为 160 MPa [23 kpsi];其合金牌号未知。)这些疲劳强度与上文 Boyer 的数据一致。(注意,通过施加特殊技术(例如引入残余压应力),疲劳强度有可能提高到 138 MPa 以上。这在很大程度上取决于载荷类型。)
|
|
|
耐久极限
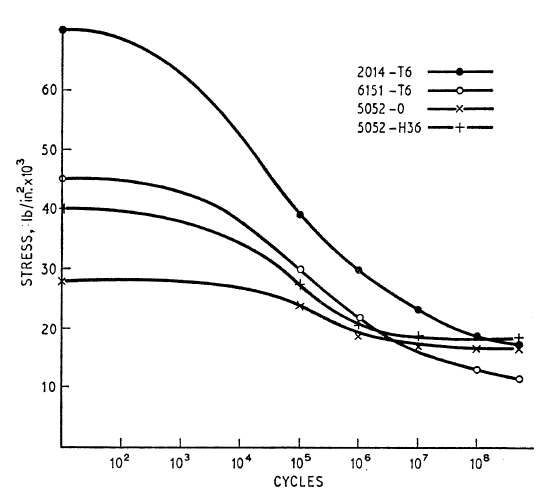
人们常说铝没有耐久极限 —— 也就是说,只要循环次数足够多,无论交变应力多低,它们最终都会发生疲劳。然而,来自 Varley[1](第 42 页)的图 3 表明,情况未必如此。 该图比较了两种可热处理合金和两种不可热处理合金的疲劳性能。对于所测试的合金,该图展示了两个重要现象 ——
- 对于两种不可热处理合金(5052-0、5052-H36),当循环次数超过 107 时疲劳曲线趋于平坦;这表明这些合金可能具有耐久极限。另一方面,对于两种可热处理合金(2014-T6、6151-T6),即使在 5x10⁸ 次循环时疲劳曲线仍在继续下降;因此,在所测试的循环范围内,这些材料没有耐久极限。
- 在图 3 中,材料的静强度是其曲线与纵轴的交点(即零次循环时的强度)。从该图可以看出,高静强度并不一定预示着优异的高周疲劳性能。例如,6151‑T6 的静强度优于两种不可热处理合金中的任何一种,但其高周疲劳性能却逊于两者。根据曲线的斜率,随着疲劳循环次数超过 5x10⁸,这种劣势很可能会进一步增大。Juvinall[1](第 215 页)指出:"作为一类材料,可热处理铝合金的疲劳比更低,也不像不可热处理合金那样倾向于趋近真正的耐久极限。最近的冶金学研究 [8,20] 提供了一个可能的部分解释:室温下的疲劳应力会使经过热处理的合金发生过时效。"
基于其高周疲劳性能,人们可能会得出图 3 中的不可热处理铝是更优谐振器材料的结论。然而,对于超声应用,静强度同样需要考虑,因为在谐振器拧紧时需要静强度来抵抗螺纹应力。
注意 —— Varley 没有给出其数据的任何细节。因此,无法得知图中数据点是代表单次失效,还是代表给定应力水平下多次失效的平均值。如果属于前者,那么考虑到疲劳寿命的典型离散性,这些曲线的平滑程度似乎好得令人难以置信。尽管如此,对不可热处理合金进行超高周疲劳范围的进一步研究似乎是有必要的。
注 —— 除了上述合金之外,还有许多其他不可热处理合金和可热处理合金。不可热处理合金属于 1XXX、3XXX、4XXX 和 5XXX 系列。可热处理合金属于 2XXX、6XXX 和 7XXX 系列。不过也有一些例外。(参见 Hatch[1],第 352-354 页。)
|
|
|
品质因数(Q)
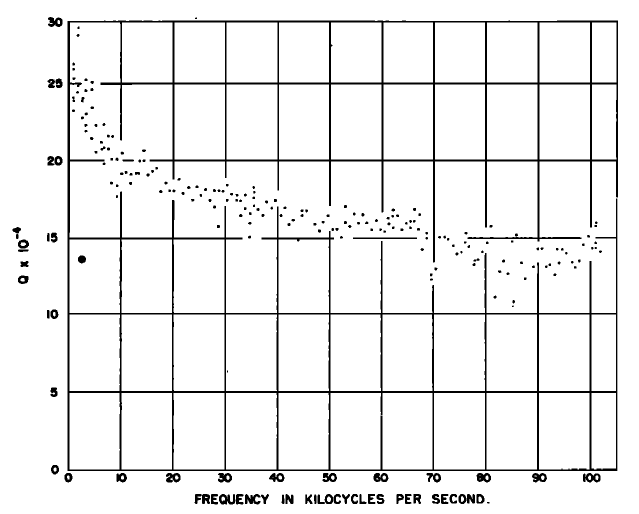
Zemanek[1C]用一根 Ø12.7 mm x 3048 mm 长的杆测量了 24 ST(即现在的 Al 2024‑T4)的 Q 值。该杆在真空中以低振幅进行静电激励,处于纵向谐振状态。所得数据如图 4 所示。在 20 kHz 时,Q 值约为 180,000。(注意,Y 轴上的数值必须乘以 104 才是实际的 Q 值。)
|
|
|
Zemanek[1C](第 1285 页)评论说,弯曲谐振的阻尼比纵向谐振更高。不过,尚不清楚他指的是弯曲模态的固有特性,还是由他激励弯曲模态的方式所致。
注:Culp[0]曾尝试用全波/半波法测量 Al 7075‑T6 的 Q 值,所用变幅杆为 Ø17.3 mm,频率为 20 kHz。然而,由于低应变下的损耗测量不可靠,结果有些不确定。不过,在最大峰值应变 0.00155(62 微米_峰值)时,前半波段的平均净损耗约为 1.8 瓦。这相当于 Q 值约为 92000。然而,由于测试方法不同,这些数据不足以得出 Al 7075‑T6 的 Q 值逊于 Al 2024‑T4(见上文)的结论。(注:尽管 Culp 的测试是在空气中进行的,但由于最初的全波测试和随后的半波测试以相同振幅运行,变幅杆末端的声辐射(即传递给空气的能量)被假定为恒定不变。因此,这种声辐射对净功率损耗没有任何影响。)
与钛的比较
对于一种未指明牌号、在相同测试条件下 Q 值为 27000 的钛,Culp 测得的净损耗为 9.7 瓦。因此,根据 Culp 的有限数据,Al 7075‑T6 的损耗比该钛低约 80%。
考虑 Mason 的数据中 Ti-6Al-4V 的 Q = 20000,以及上文 Zemanek 的数据(Q = 180,000),Al 2024‑T4 的损耗比 Ti-6Al-4V 低约 93%。不过,Mason 测试的应变明显高于 Zemanek,尚不清楚这是否会影响比较结果。
定性地说,在相同条件下,铝保持冷却,而钛会变温甚至发热。(当然,铝保持较低温度的部分原因是其热导率更高,从而能将热量从高应变区域传导出去。)
泊松比
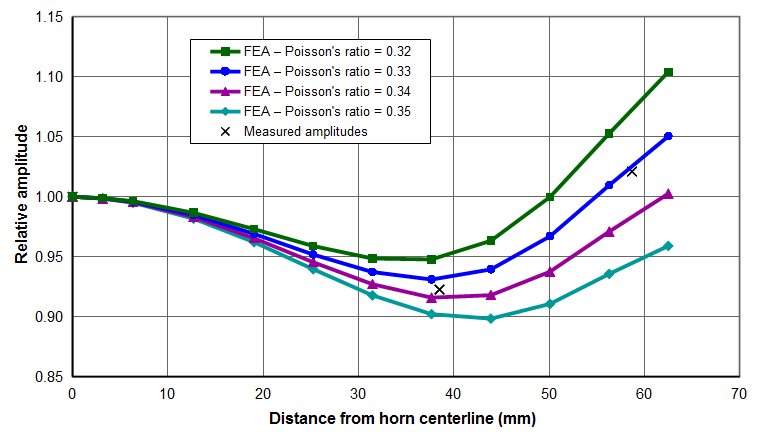
Culp[0]通过将一个 20 kHz Ø125 mm 半线轴形变幅杆的实测振幅与 FEA 预测值进行比较,确定了 Al 7075‑T6 圆柱棒料的泊松比。图 5 显示,实测的"X"数据与泊松比为 0.33 的 FEA 曲线最为吻合。(在图 4 中,每个"X"数据实际上是变幅杆端面圆周上八个振幅测量值(以 45° 等间隔分布)的平均值。这些测量值的离散很小,因此数据被认为是可靠的。)
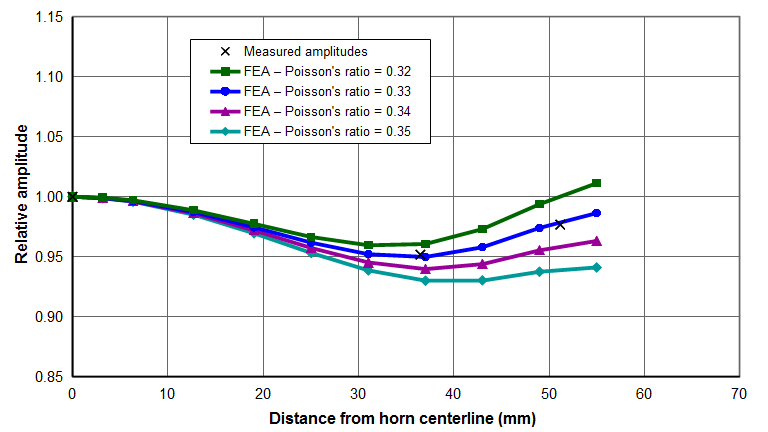
对一个同样由 Al 7075‑T6 圆柱棒料制成的 20 kHz Ø110 mm 半线轴形变幅杆的分析显示了类似的结果(图 5a)。不过,泊松比对端面振幅的影响没有那么显著。
作为比较,matweb.com 给出的 Al 2024‑T4 和 Al 7075‑T6 的泊松比均为 0.33。
有趣的是,泊松比的微小变化会对相对端面振幅产生显著影响。
|
|
|
|
|
|
方向性
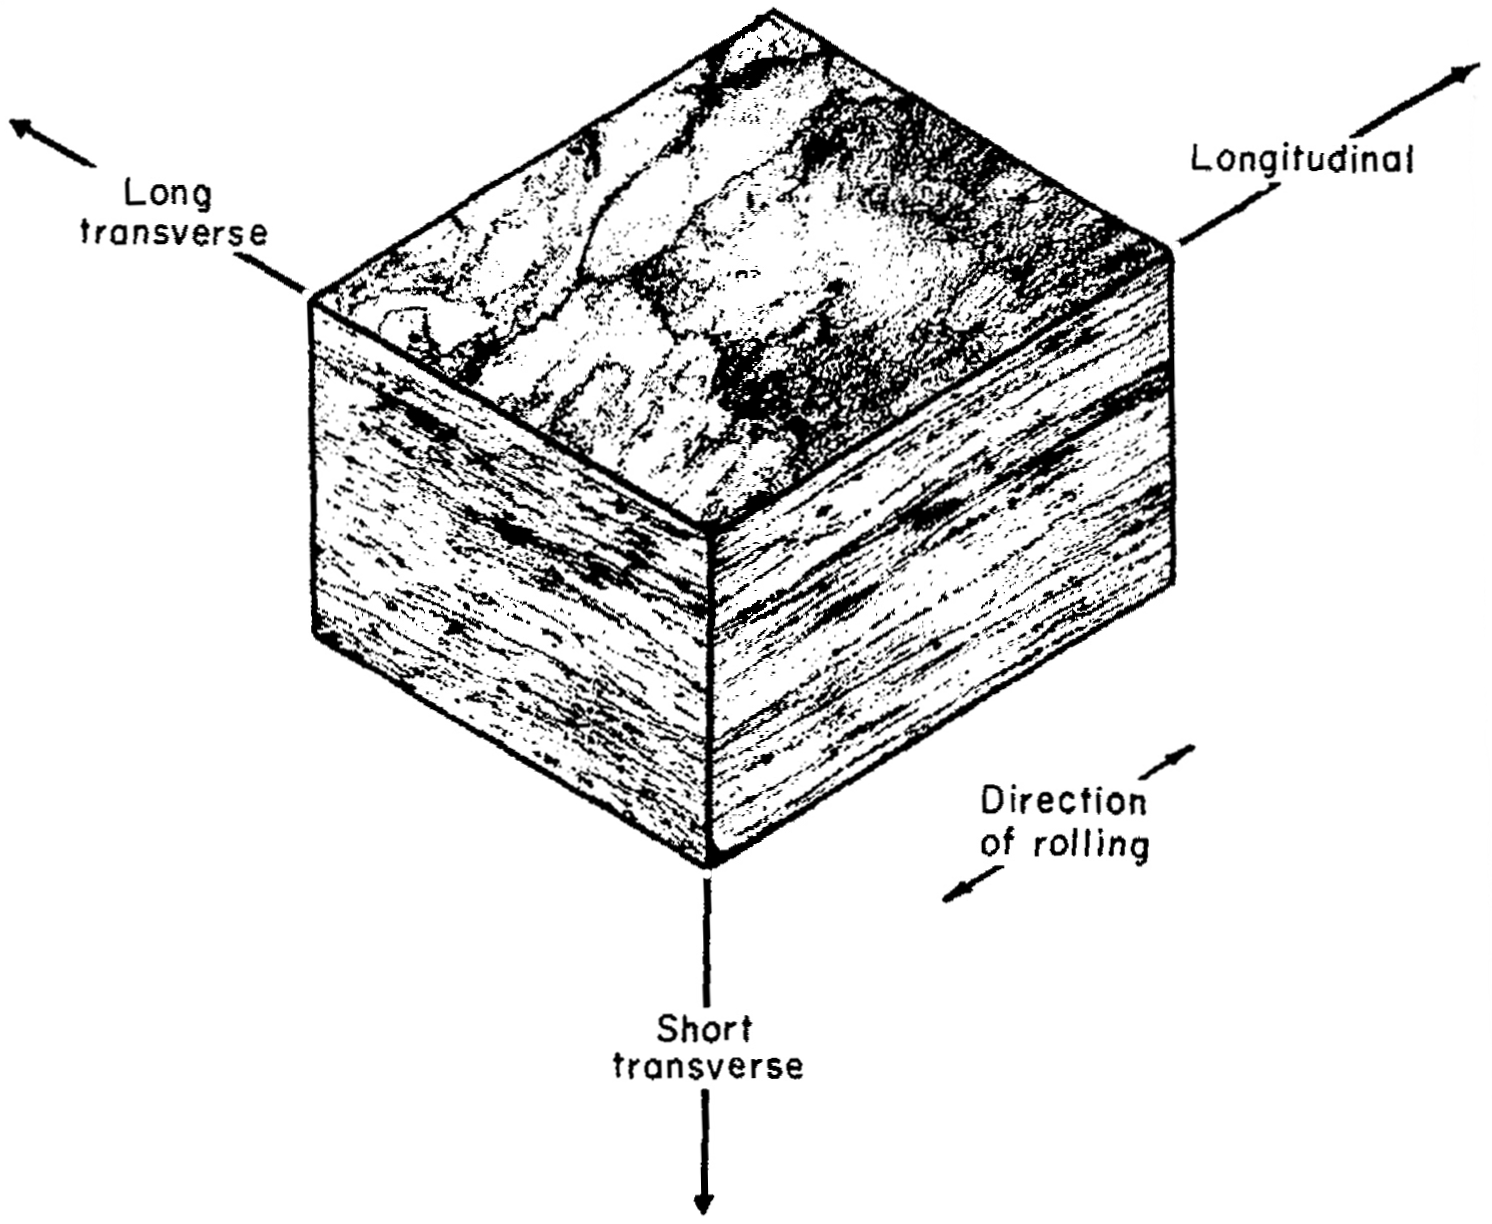
退火状态下未经冷加工的铝具有随机取向的晶粒,是各向同性的 —— 即其力学性能在所有方向上都相同。 然而,一旦经过冷加工(例如轧制、挤压等),晶体就会重新取向,材料不再是各向同性的(参见 Hatch[1] 第 376 页的图 5)。此时,材料性能取决于测试方向。
|
|
|
这些方向性性能会影响调谐。例如,加工了两个完全相同的 20 kHz 双槽条形变幅杆。第一个变幅杆的加工使材料的纵向与螺柱轴线平行(即晶粒方向与螺柱轴线平行);第二个变幅杆的加工使材料的长横向与螺柱轴线平行(即晶粒方向与螺柱轴线垂直)。第一个变幅杆的轴向频率比第二个低 125 Hz(0.6%)(Culp[0])。这表明材料纵向上的杨氏模量约低 1.3%。与第二个变幅杆相比,第一个变幅杆的主要非轴向谐振频率也有所降低。
方向性对均匀性的影响尚不清楚。
材料性能的最佳估计值
|
||||||||||||||||||||||||
|
表格注释 ——
- 除非另有说明,性能数据由 Culp[0] 测定。
- 疲劳强度为无缺口试样的数据,来自 Boyer(第 335 页)(参见上文疲劳)。
- 这些性能未考虑坯料类型(棒材、条材、板材)或方向性。
- 对于 2024-T3,材料性能是通过对照一个实测变幅杆校准 FEA 确定的。
- 对于 7075-T6,性能数据通过以下方式确定 ——
- 对照实测变幅杆校准 FEA(7 个试样)。
- 在 Herfurth 压电振动台上不连接换能器测量变幅杆频率(8 个样品)。
- 全波 —— 半波测量(5 个样品)。
表面处理
多种镀层已成功用于铝上,且疲劳性能未见明显下降。这些镀层包括软镍、软铬和阳极氧化。使用硬质镀层时必须小心,因为它们可能在应力作用下开裂。由此产生的裂纹可能扩展进入铝基体,导致失效。不过,如果将大多数镀层用于低应力区域(例如端面),则是可以接受的。
蚀刻
铝的晶粒方向可以用 Keller 蚀刻剂检查(加工前或加工后均可)(1% HF(氢氟酸)、1.5% HCl(盐酸)、2.5% HNO3(硝酸),余量为水)。对于铜基铝合金(2000 系列,如 2024),推荐使用 Kroll 试剂(1% HF(氢氟酸)、12% HNO3(硝酸),余量为水)。两者均有市售。
Aluminum properties
Contents
- Figures
- Figure 1. Rotating beam fatigue tests for Al 2024‑T4 and Al 7075‑T6
- Figure 2. Effect of tensile strength on fatigue strength for common wrought aluminum alloys
- Figure 3. Fatigue curves for heat-treatable (2014-T6, 6151-T6) and non-heat-treatable (5052-0, 5052-H36) aluminum alloys
- Figure 4. Q of 24 ST (2024‑T4) aluminum
- Figure 5. Ø125mm Al 7075‑T6 spool horn — Effect of Poisson's ratio on axial face amplitudes
- Figure 6. Ø110mm Al 7075‑T6 spool horn — Effect of Poisson's ratio on axial face amplitudes
- Figure 7. Directionality in flat rolled Al 7075-T6
- Tables
- Table 1. Best estimates of aluminum material properties
Uses
Because of its relatively low cost and ease of machining, aluminum is often a first choice for ultrasonic resonators where stresses are low and impact/wear/erosion are not important. Uses include —
- Large cylindrical horns
- Large block horns
- Mother horns
- Low gain boosters
- Transducer front drivers
Cross references
A specification cross reference for various grades of aluminum can be found here. This cross reference includes U.S., Canadian, British, French, German, Italian, and Japanese designations.
Common alloys
Aluminum is available in a very large number of alloys. Two commonly used alloys are Al 2024‑T4 and Al 7075‑T6. (The "T" indicates the temper. Various tempers are available which may affect the performance.)
Fatigue
See a general discussion of fatigue.
Most aluminums do not have a true endurance limit. Instead, the negative slope of the S‑N curve becomes more shallow as the number of cycles becomes large. (However, see Varley below.)
The following graphs from Boyer (p. 335) show the fatigue performance of Al 2024‑T4 and Al 7075‑T6 in low frequency rotating‑beam tests. (Original source: Sanders[1], p. 470) The upper band of solid dots is for unnotched specimens whereas the lower band of open dots is for severely notched specimens (Kt > 17). The colored rectangles at the right ends of the data bands are for specimens that did not fail (runout specimens).
|
|
|
Note that the fatigue performance of the two alloys is very similar. In the unnotched condition both have fatigue strengths in the vicinity of 140 MPa [20 kpsi] at ~109 cycles although Al 7075‑T6 performs somewhat better. In the notched condition Al 7075‑T6 performs somewhat worse.
Boyer[1] (p. 335) notes, "Despite these laboratory data, users discovered that certain aluminum alloys performed decidedly better than others in service when fluctuating loads were encountered. For example, airframe manufacturers determined that fatigue performance of alloy 7075‑T6 was unquestionably inferior to that of alloy 2024‑T3." Boyer does not indicate whether this applies to unnotched or notched or both.
Figure 2 from Juvinall[1] (p. 215) shows the relationship between fatigue strength and ultimate tensile strength for various aluminum alloys. Up to an ultimate tensile strength of about 340 MPa [50 kpsi], the fatigue strength is about 40% of the ultimate tensile strength. However, if the ultimate tensile strength exceeds 340 MPa then the fatigue strength doesn't increase further but, instead, plateaus at about 138 MPa [20 kpsi]. (Note that the two right-most data points have a fatigue strength of about 160 MPa [23 kpsi]; the alloys are not known.) These fatigue strengths are in line with those of Boyer above. (Note that the fatigue strength might be improved above 138 MPa by applying special techniques such as inducing residual compressive stresses. This will depend highly on the type of loading.)
|
|
|
Endurance limit
It is often stated that aluminums do not have an endurance limit — i.e., they will ultimately fatigue if the number of cycles is sufficiently great, regardless of how low the alternating stress is. However, figure 3 from Varley[1] (p. 42) suggests that this is not necessarily true. This figure compares the fatigue performance of two heat-treatable and two non-heat-treatable alloys. For the tested alloys this graph shows two important phenomena —
- For the two non-heat-treatable alloys (5052-0, 5052-H36) the fatigue curves flatten when the number of cycles exceed 107; this indicates that these alloys may have an endurance limit. On the other hand, for the two heat-treatable alloys (2014-T6, 6151-T6) the fatigue curves continue to decline even at 5x10⁸ cycles; hence, these materials don't have an endurance limit within the range of tested cycles.
- In figure 3 a material's static strength is the intersection of its curve with the vertical axis (i.e., the strength at zero cycles). It can be seen from this graph that a high static strength does not necessarily predict superior high-cycle fatigue performance. For example, 6151‑T6 has superior static strength compared to either of the non-heat-treatable alloys but is inferior to both at high-cycle fatigue. Based on the slopes of the graphs, it is likely that this inferiority increases as the number of fatigue cycles increases beyond 5x10⁸. Juvinall[1] (p. 215) notes, "As a class, heat-treatable aluminum alloys have lower fatigue ratios and less tendency to approach a true endurance limit than do non-heat-treatable alloys. Recent metallurgical studies [8,20] offer a likely partial explanation: fatigue stressing at room temperature causes overageing of heat-treated alloys."
Based on their high-cycle fatigue performance, one might conclude that the non-heat-treatable aluminums of figure 3 would be superior resonators. However, for ultrasonic applications the static strength also needs to be considered since static strength is needed to resist thread stresses during resonator tightening.
Caution — Varley doesn't give any details of his data. Therefore, it is not known if the graphed data points represent individual failures or averages of multiple failures at a given stress level. If the former is true then the smoothness of these curves seems almost too good to be true, given the typical variability in fatigue lives. None-the-less, further investigation into the ultra-high cycle fatigue range for non-heat-treatable alloys seems warrented.
Note — There are many other non-heat-treatable and heat-treatable alloys beyond those mentioned above. Non-heat-treatable alloys are in the 1XXX, 3XXX, 4XXX, and 5XXX series. Heat-treatable alloys are in the 2XXX, 6XXX, and 7XXX series. However, there are some exceptions. (See Hatch[1], pp. 352-354.)
|
|
|
Quality factor (Q)
Zemanek[1C] measured the Q of 24 ST (now Al 2024‑T4) in a Ø12.7 mm x 3048 mm long rod. The rod was electrostatically driven at low amplitude at longitudinal resonance in a vacuum. The resulting data are shown in figure 4. At 20 kHz the Q is approximately 180,000. (Note that the value on the Y axis must be multiplied by 104 to give the actual Q value.)
|
|
|
Zemanek[1C] (p. 1285) commented that flexural resonances are more highly damped than longitudinal resonances. However, it is not clear if he meant this as an inherent characteristic of the flexural mode or whether this was due to his means of exciting the flexural mode.
Note: Culp[0] tried to measure the Q of Al 7075‑T6 using the full‑wave/half‑wave method with a Ø17.3 mm horn at 20 kHz. However, the results were somewhat inconclusive because the loss measurements at low strains were unreliable. However, at the maximum peak strain of 0.00155 (62 microns_peak), the average net loss of the front half-wave section was about 1.8 watts. This would equate to a Q of about 92000. However, because of the difference in the test methods this data may not be sufficient to conclude that the Q of Al 7075‑T6 is inferior to that of Al 2024‑T4 (above). (Note: although Culp's tests were run in air, the acoustic radiation (i.e., energy transferred to the air) from the end of the horn was assumed to be constant between the initial full‑wave test and the subsequent half‑wave test since both were run at the same amplitude. Therefore, this acoustic radiation did not have any effect on the net power loss.)
Comparison to titanium
For an unspecified titanium with a Q of 27000 under the same test conditions, Culp measured a net loss of 9.7 watts. Thus, based on the limited data from Culp, the loss of Al 7075‑T6 would be about 80% less than the titanium.
Considering Mason's data for Ti-6Al-4V (Q = 20000) and Zemanek's data above (Q = 180,000), the loss of Al 2024‑T4 would be about 93% less than Ti-6Al-4V. However, the strains of Mason's tests were significantly higher than those of Zemanek although it is not known if this would affect the comparison.
Qualitatively, aluminum remains cool where titanium becomes warm or hot under the same conditions. (Of course, aluminum remains cooler, in part, because of its higher thermal conductivity whereby heat is conducted away from the areas of high strain.)
Poisson's ratio
Culp[0] determined Poisson's ratio for Al 7075‑T6 cylindrical stock by comparing the measured amplitudes of a 20 kHz Ø125 mm half-spool horn to those predicted by FEA. Figure 5 shows that the measured "X" data agree most closely with the FEA curve whose Poisson's ratio is 0.33. (In figure 4, each of the "X" data is actually the average of eight amplitude measurements (equally spaced at 45°) around the face of the horn. The variation in these measurements was small so the data is assumed to be reliable.)
Analysis of a 20 kHz Ø110 mm half-spool horn, also made of Al 7075‑T6 cylindrical stock, showed similar results (figure 5a). However, the effect of Poisson's ratio on the face amplitude was not as pronounced.
For comparison, matweb.com gives a value of 0.33 for both Al 2024‑T4 and Al 7075‑T6.
It is interesting that a small change in Poisson's ratio has a significant effect on the relative face amplitudes.
|
|
|
|
|
|
Directionality
Aluminum in the annealed condition that has not been cold worked will have randomly oriented grains and will be isotropic — i.e., its mechanical properties will be uniform in all directions. However, once it has been cold worked (e.g., by rolling, extrusion, etc.) the crystals reorient themselves so that the material is no longer isotropic (see figure 5 from Hatch[1], p. 376). Then the material properties depend on the test direction.
|
|
|
These directional properties can affect tuning. For example, two identical 20 kHz 2‑slotted bar horns were machined. The first horn was machined so that the longitudinal material direction was parallel to the stud axis (i.e., grain direction parallel to the stud axis); the second horn was machined so that the long-transverse material direction was parallel to the stud axis (i.e., grain direction transverse to the stud axis). The axial frequency of the first horn was 125 Hz (0.6%) lower than the second horn (Culp[0]). This indicates that Young's modulus is about 1.3% lower in the longitudinal material direction. The principal nonaxial resonances of the first horn were also reduced compared to the second horn.
The effect of directionality on uniformity is not known.
Best estimates of material properties
|
||||||||||||||||||||||||
|
Table notes —
- Unless otherwise indicated, the properties were determined by Culp[0].
- The fatigue strengths are for unnotched specimens from Boyer (p. 335) (see Fatigue above).
- The properties don't consider the stock type (rod, bar, plate) or directionality.
- For 2024-T3, the material properties were determined by calibrating FEA against one measured horn.
- For 7075-T6 the properties were determined by —
- FEA calibration against measured horn (7 specimens).
- Horn frequency measured on Herfurth piezo shake table without attached transducer (8 samples).
- Full-wave — half-wave measurements (5 samples).
Surface treatments
A number of coatings have been used successfully with aluminum without apparent reduction in fatigue performance. These include soft nickel, soft chrome, and anodizing. Care must be used with hard coatings because these may crack under stress. The resulting cracks may then propagate into the aluminum, causing failure. However, most coatings are acceptable if used in low-stressed regions (e.g., the face).
Etching
The grain direction in aluminum can be checked (either before or after machining) with Keller's etch (1% HF (hydrofluoric acid), 1.5% HCl (hydrochloric acid), 2.5% HNO3 (nitric acid), balance water). For copper-based aluminum alloys (the 2000 series such as 2024) Kroll's Reagent (1% HF (hydrofluoric acid), 12% HNO3 (nitric acid), balance water) is recommended. Both which are available commercially.